")
")
Background
The Google Maps API offers the possibility to decorate a map with elements such as markers, lines and polygons. But using this API to add these elements has a few disadvantages. For example when adding many elements the webpage becomes slow, it requires the developer to know Javascript, HTML and CSS and furthermore the elements that can be added are limited to what is available within the API.
A possible alternative is to use a KMLLayer. To display data in a KMLLayer the data have to be a publicly hosted in a KML file on the internet, so that Google's servers can find the content to display it on the map. The advantage of this method is that rendering of all the data is quick because everything is rendered on a server. But it requires the developer to be familiar with the KML format.
Fortunately the Google Maps API offers the possibility to make a custom tileserver. A tileserver generates images which can contain any drawing which are in turn assembled in the frontend to form an extra layer on top of the map. One of the big advantages of tileservers is that everything can be generated in the backend and that displaying rendered images served from a web server is much less computationally demanding than rendering images in the browser. In our case another advantage is that these images can be created in Matlab (by using the Modelit Webserver Toolbox) where we can use all our Matlab experience and tools to create the images.
In this post we describe how you can create your own application with a custom tileserver for Google Maps using Matlab and the Modelit Webserver Toolbox.
The example
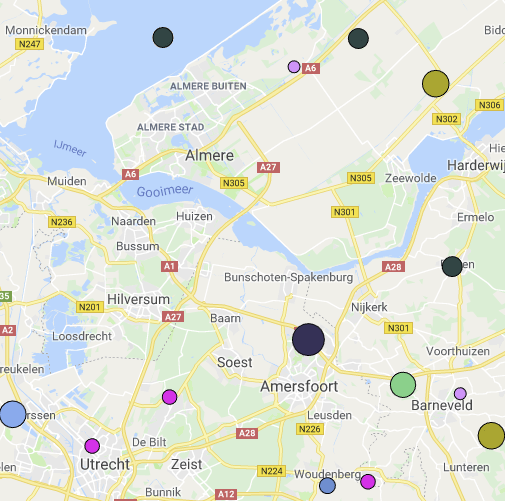
Below, A Google map is shown, with realtime and historic traffic data displayed on top. Zooming in on the map will reveal additional details.
How it's done
The application that we are going to make consists of a frontend and a backend. The frontend is an html file that runs in a browser and makes calls to the backend which runs in Matlab or, by using the Matlab Compiler, as a standalone application. The frontend and backend are linked together with the Modelit Webserver Toolbox and an Apache Tomcat server.
Prerequisites
- The Modelit Webserver Toolbox
- Matlab®;
- Optional: Matlab® Compiler (for producing standalone versions of the webservice)
- Apache Tomcat (available for free with XAMPP)
- Google Maps api key
- A texteditor to edit the .xml, .html en .js files. for example notepad++ or visual code
In the following two sections the implementation details of the frontend and the backend are given.
The last section describes how to test and deploy the application.
All the code is available in the Modelit Webserver Toolbox.
Implementation details of the frontend
The frontend consists of an html page showing a Google Map, with some basic styling to adjust the size of the Map.
Javascript is used to take care of the visualisation of the Map and the custom tiles generated by the Matlab backend.
The application entry point:
Make an index.html file which will serve as the application's entry point.
The body of this html file consists of a single div element with id "map-canvas". This id will later be used to create the Map.
<body>
<div id="map-canvas"></div>
</body>
Load the Google Maps API in a script tag in the header of the html file. This makes the code available for creating a Google Map.
<script src="https://maps.googleapis.com/maps/api/js?key=YOURKEY"></script>Replace the text YOURKEY with your Google Maps API key. If you don't specify your Google Maps API key the Map will show up with warnings that the Map can only be used for development purposes.
This html file contains some javascript code which adds a DOM event listener for the 'load' event, and specifies a the "initialize" function to run when the window is loaded.
This function will be defined in a separate file tileserver.js.
For the styling of the webpage an external stylesheet styles.css is referenced. The styling of the webpage is restricted to specifying the size of the Map component.
This css file will be made in the Layout section.
index.html (the entry point for the tileserver)
<!DOCTYPE html>
<html>
<head>
    <link rel="stylesheet" type="text/css" href="/styles.css">
    <script src="https://maps.googleapis.com/maps/api/js?key=YOURKEY"></script>
	<script src="/tileserver.js"></script>
    <script>
        google.maps.event.addDomListener(window, 'load', initialize);
    </script>
</head>
<body>
<div id="map-canvas"></div>
</body>
</html>
The layout:
Make a file styles.css and put it in the directory with the index.html file.
In this case the .css file is only used to make the Map occupy all the available space in the window.
Set therefore the height and width of the div which contains the Map to 100%. The id selector "#map-canvas" can be used to select this div.
Furthermore the heights of all the Map's parents (body and html) have to be explicitly set to 100%.
The code of the css file is given in the next code block.
styles.css
body, html {
	height: 100%;
}

#map-canvas {
	width: 100%;
	height: 100%;
}
The business logic:
In the index.html file the function "initialize" is called when the window has been fully loaded.
This function can be used to:
- Create and position the map
- Create the tileserver
Create the map:
To create a map a google.maps.Map object is used. The syntax follows from the documentation.
| Constructor | |
|---|---|
Map |
Map(mapDiv[, opts])Parameters:
|
- The reference to the div with id "map-canvas" created in the index.html can be obtained by using the getElementById method of the global (HTML) document object.
- The syntax of the second argument is described in MapOptions.
In this example the map is centered on the Netherlands by using the appropriate zoom and center properties.
See MapType for the available Map types (for example roads or satellite).
Create the tileserver:
The tileserver has to provide the frontend with image tiles and can be created by using the ImageMapType class which takes one argument opts of type ImageMapTypeOptions
| Constructor | |
|---|---|
ImageMapType |
ImageMapType(opts)Parameters:
Constructs an ImageMapType using the provided ImageMapTypeOptions
|
To create the ImageMapTypeOptions object two parameters are required:
- tileSize: specifies the size of the tiles (of type google.maps.Size). In this case the tiles are 256x256 pixels. Make sure that the backend generates images with the same size.
- getTileUrl: a string that given an x-, y-coordinate and a zoomlevel points to the url of the tile to be generated. (getTileUrl can also be a function returning a string)
The Javascript file in the code block below can be used to test, the url to the tileserver points to a dummy tile image.
tileserver.js (with dummy url)
function initialize() {

	var mapCanvas = document.getElementById('map-canvas');
	var mapOptions = {
		center: new google.maps.LatLng(52.3, 5.4), // Center on the Netherlands
		zoom: 8,
		mapTypeId: google.maps.MapTypeId.ROADMAP
	};
	var map = new google.maps.Map(mapCanvas, mapOptions);

	var imageMapType = new google.maps.ImageMapType({
			getTileUrl: function (coord, zoom) {
				return 'https://www.modelit.nl/dummy_tile.png'; // dummy url
			},
			tileSize: new google.maps.Size(256, 256) // Make sure that the tiles generated in the backend are also 256x256
		});

	map.overlayMapTypes.push(imageMapType);

}
To finalize the implementation of the frontend replace the dummy url with the url that points to the new tileserver that will be created in the next section.
By dynamically constructing the url from the x- and y-coordinates and the zoomlevel in the getTileUrl method the tileserver will be able to uniquely determine which tile to produce.
['http://localhost:8080/matlabserver/tileviewer?zoom=', zoom, '&x=', coord.x, '&y=', coord.y].join('');tileserver.js (final version)
function initialize() {

	var mapCanvas = document.getElementById('map-canvas');
	var mapOptions = {
		center: new google.maps.LatLng(52.78313383212, 2.4039494991302),
		zoom: 8,
		mapTypeId: google.maps.MapTypeId.ROADMAP
	};
	var map = new google.maps.Map(mapCanvas, mapOptions);

	var imageMapType = new google.maps.ImageMapType({
			getTileUrl: function (coord, zoom) {
				return ['http://localhost:8080/matlabserver/tileviewer?zoom=', zoom, '&x=', coord.x, '&y=', coord.y].join('');
			},
			tileSize: new google.maps.Size(256, 256)
		});

	map.overlayMapTypes.push(imageMapType);

}
Implementation details of the backend
The task of the server is to process requests from the frontend.
These requests consist of (x, y, zoom) tuples that uniquely identify the tiles.
From these requests the backend generates and returns tiles in the form of 256x256 pixel images (png).
The backend consists of a server which waits for incoming requests from the Apache Tomcat server and a callback that is triggered when a request arrives.
In the next two sections the implementation of these two components is given.
The server
In this step a server is created in Matlab with the Modelit Webserver Toolbox. This server waits for incoming requests.
These requests are initiated by the frontend and are redirected from the Apache Tomcat to Matlab.
When a request arrives a callback is invoked which produces and returns an image.
This callback is specified in the 'ServerInvokedCallback' argument of the server, its implementation is given in the next section.
Besides creating the server running on port 3338 also a figure is created with a number of random markers.
This map is static; it is not changed between the callbacks and therefore is created during initialization of the application. If you need a dynamic Map you can use the callback function to update the Map.
tileserver.m
function server = tileServer
% tableServer - Create a server on port 3338
% the ports should be a specified in the web.xml in the matlabserver
% directory in the Tomcat root.
%
% CALL:
%  server = tableServer
%
% INPUT:
%  No input
%
% OUTPUT:
%  server:
%   nl.modelit.matlabserver.MatlabServer, this object triggers the callback
%   'callback' in this function whenever a client makes a request
%

% Make sure that the java\MatlabServer.jar is included
if installjar(false)
    server = [];
    return
end

port = selectPort([3338 3339]);

% Create figure outside visible area of monitor
delete(gch(mfilename,0));
HWIN = figure('NumberTitle','off',...
    'name',sprintf('TileViewer (port %d)',port),...
    'menubar','none',...
    'tag',mfilename,...
    'visible','on',...
    'units','pixels',...
    'position',[-1000 -1000 256 256],... % tilesize is 256x256 pixels !
    'PaperPositionMode','auto');

h = axes('visible','off',...
    'tag','data_axis',...
    'hittest','on',...
    'nextplot','replacechildren',...
    'ActivePositionProperty','position',...
    'YAxisLocation','left',...
    'Box','Off',...
    'XGrid','off',...
    'YGrid','off',...
    'xtick',[],...
    'ytick',[],...
    'linewidth',1,...
    'layer','bottom',...
    'Color','none',...
    'units','normalized',...
    'position',[0 0 1 1]);

% Plot random markers
for i=1:10
   line(h, 'xdata', 2 + 5*rand(100,1), 'ydata', 50 + 5*rand(100,1),...
       'marker', 'o',...
       'markersize', 8+randi(16),...
       'markerfacecolor', rand(1,3),...
       'linestyle', 'none');
end

server = createMatlabServer(port);
% Set callback to be executed when server receives a request from client

set(server, 'ServerInvokedCallback', @(o,e)callback(o, e, HWIN));

% Start listening, until process is killed
startServer(server);

disp(sprintf('Table server is ready and listening to port %d.',port));
The callback
The callback should produce and return a 256x256 pixel png image. This image is generated according to the request parameters which are extracted from the request.
In the code block below the outline of the function is given. The three parts that need to be implemented are:
- Get the request parameters
- Zoom in on the requested tile
- Generate and return an image
The code for these three parts is given in the next sections.
callback.m (outline)
function callback(obj, event, HWIN, h)
% callback - Callback to be executed on client's request
%
% CALL:
%  callback(obj, event, HWIN)
%
% INPUT:
%  obj:
%   <nl.modelit.matlabserver.MatlabServer>
%  event:
%   <nl.modelit.matlabserver.ServerEvent>, user event2Struct to get data from
%   this object
%  HWIN:
%   Figure
%  h:
%   Axis with the plot, used to zoom in on a tile
%
% OUTPUT:
%  no output
%
% APPROACH:
%  Server expects messages with arguments
%   - x: tilecoordinate
%   - y: tilecoordinate
%   - zoom: zoomlevel
%
%  Arguments can be extended e.g. add
%  x = getQueryValue(query, 'arg', '?');
%  to add argument 'arg' with default value '?'

% It's good practice to surround the callback with try catch
% and always return an answer to the client
try

    errormsg = '';
    response = '';
    format = 'png';

    % Get request data
    S = event2struct(event);

    % Only http get and http post are allowed
    % Send errormessage if methods in not get or post
    switch lower(S.RequestMethod)
        case 'get'
            query = parseQueryString(S.RequestQueryString);
        case 'post'
            query = parseQueryString(S.RequestBody);
        otherwise
            errormsg = sprintf('%s not allowed', S.RequestMethod);
            processResponse(event, format, response, errormsg);
            return
    end

    <Get request parameters>
    <Zoom in on tile>
    <Generate image>

    % Return response to the client
    processResponse(event, format, response, errormsg);

catch me
    disp_err(me)
    data = get(event,'data');
    data.setResponseData(me.message);
    event.setResponseStatus(500); % Internal Server Error
    event.returnData;
end
Get the request parameters
The frontend makes requests to the backend to obtain tiles, These tiles are uniquely identified by three parameters
- x: the x coordinate of the tile
- y: the y coordinate of the tile
- zoom: the zoomlevel
At zoomlevel 0 the entire world is visible in one tile for every subsequent zoomlevel every tile is divided in four. In the figure below the (x, y) tilecoordinates are displayed for zoomlevel 10.
For an example to see how the tile coordinate system works see https://developers.google.com/maps/documentation/javascript/examples/maptype-overlay
Example of requested tiles at zoomlevel 10, the x and y coordinates are given in the upper left corner of each tile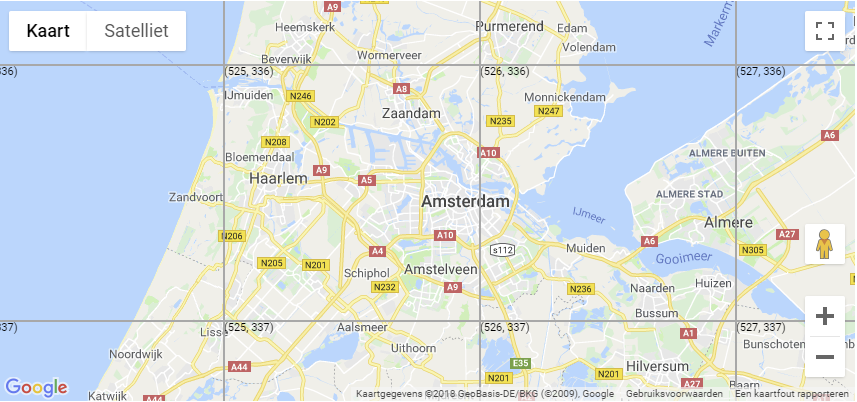
These query parameters can be sent from the backend as a:
- HTTP GET request. The parameters are sent in the url after the question mark. For example http://localhost:8080/matlabserver/tileviewer?zoom=10&x=525&y=336
- HTTP POST request. The parameters are sent in the body of the request, see
See HTTP methods for more information about HTTP methods.
 % Get request data
 S = event2struct(event);

 % Only http get and http post are allowed
 % Send errormessage if methods in not get or post
 switch lower(S.RequestMethod)
     case 'get'
         query = parseQueryString(S.RequestQueryString);
     case 'post'
         query = parseQueryString(S.RequestBody);
     otherwise
         errormsg = sprintf('%s not allowed', S.RequestMethod);
         processResponse(event, format, response, errormsg);
         return
 end
The utility getQueryValue can be used to extract the values for x, y and zoom from the request. Its arguments are:
- The query object that is sent with the request from the frontend.
- The name of the parameter.
- The default value for the parameter.
Extract the request parameters
 x = getQueryValue(query, 'x', 131);
 y = getQueryValue(query, 'y', 84);
 zoom = getQueryValue(query, 'zoom', 8);
Zoom in on the requested tile:
With the obtained x, y and zoom parameters the function tile_boundingbox can be used to calculate the bounding box of the requested tile. This function returns the northern, southern, eastern and western bounds in WGS coordinates of the requested tile. These bounds can be used to zoom in on the requested tile by using the xlim and ylim properties of the axis with the map.
The Matlab function inpolygon is used to exclude tiles which are outside the study area. In that case the server simply returns an empty response, which is ignored in the frontend.
Code for calculating the bounding box of the tile
 xv = [3 3 8 8];
 yv = [50 54 54 50];
 [north, south, west, east] = tile_boundingbox(x, y, zoom);

 if ~any(inpolygon([west west east east], [south north north south], xv, yv))
    % Empty tile (dealt with in front end)
    response = ' ';
 else
    set(h, 'xlim', [west east], 'ylim', [south north]);
    response = fig2tile(HWIN);
 end
Generate and return an image:
Now that we're zoomed in on the correct part of the figure we can generate the requested tile as an image by using the function fig2tile.
This function makes a transparent image from the current figure. The pixels with the same color as the figure's background color are made transparant.
The function processResponse takes care of sending back the answer in the correct format. It sets the contenttype, header and statuscode of the http response.
Deployment and testing
Now that the frontend and backend are ready the two need to be linked.
When the frontend fires a request it arrives at the Apache Tomcat server which should redirect it to the running Matlab server.
To make this connection the Apache Tomcat needs to be configured.
Install the Modelit Webserver
The following link contains the manual to Install the Modelit Webserver.
Configure the Apache Tomcat server
Create a directory 'matlabserver' in the tomcat\webapps directory (with xampp this directory is: \xampp\tomcat\webapps\)
Create a directory tomcat\webapps\matlabserver\WEB-INF directory
create a directory lib in the tomcat\webapps\matlabserver\WEB-INF directory and add the MatlabServer.jar (from the Matlabserver Toolbox)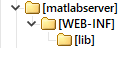
Now create the web.xml file as given below and put it in the WEB-INF directory.
Make sure that the port values (3338 and 3339) correspond to the port values defined in the call to selectPort in tileserver.m
web.xml
<?xml version="1.0" encoding="ISO-8859-1"?>

<web-app xmlns="http://java.sun.com/xml/ns/javaee"
  xmlns:xsi="http://www.w3.org/2001/XMLSchema-instance"
  xsi:schemaLocation="http://java.sun.com/xml/ns/javaee
                      http://java.sun.com/xml/ns/javaee/web-app_3_0.xsd"
  version="3.0"
  metadata-complete="true">

  <display-name>Welcome to Tomcat</display-name>
  <description>
     Welcome to Tomcat
  </description>

</web-app>

<servlet>
 	<init-param>
 		<param-name>port</param-name>
 		<param-value> 3338, 3339</param-value>
 	</init-param>
     <init-param>
         <param-name>queue</param-name>
         <param-value>16</param-value>
     </init-param>
     <init-param>
         <param-name>log</param-name>
         <param-value>20000</param-value>
     </init-param>

     <servlet-name>
         tileserver
     </servlet-name>
     <servlet-class>
         nl.modelit.matlabserver.MatlabServlet
     </servlet-class>
 </servlet>

 <servlet-mapping>
     <servlet-name>tileviewer</servlet-name>
     <url-pattern>/tileviewer</url-pattern>
 </servlet-mapping>
Our servlet now runs on http://localhost:8080/matlabserver/tileviewer (matlabserver is the directory we created and tileviewer is the url-pattern we specified for the servlet with the name tileviewer)
Start the tileserver
Run tileserver.m in Matlab, or as an executable.
Start the Apache Tomcat server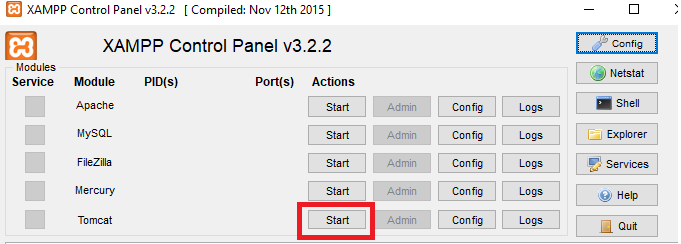
Open the frontend in the browser
Open the index.html in a browser