
")
")
MapViewer for Matlab
Many legacy Matlab GUI’s display spatial data but lack a true zoomable background map. Visualizing data against a background layer that contains a map or aerial photography helps users to quickly check and interprete data presented to them.
Nowadays many public and even free resources exist that provide high quality maps, aerial photography or relevant contextual information for various disciplines. For content providers a scalable and therefore attractive way to distribute content is through a so-called Web Map Tile Service (WMTS). A WMTS prepares server side tiles for each zoom level. Tiles have a typical size of 256x256 pixels. Clients can then retrieve and cache the tiles that are needed for a specific view.
Integrating a zoomable view in a legacy Matlab application that displays WMTS content properly together with text, lines, patches and images that belong to the original application is potentially a complex task. The Modelit MapViewer component is designed to greatly simplify this.
The idea behind the component is that from a coding point of view the MapViewer component replaces the axes object, so that migrating existing applications to WMTS requires little more than exchanging the Matlab axes command for a call to the Modelit MapViewer constructor.
Example
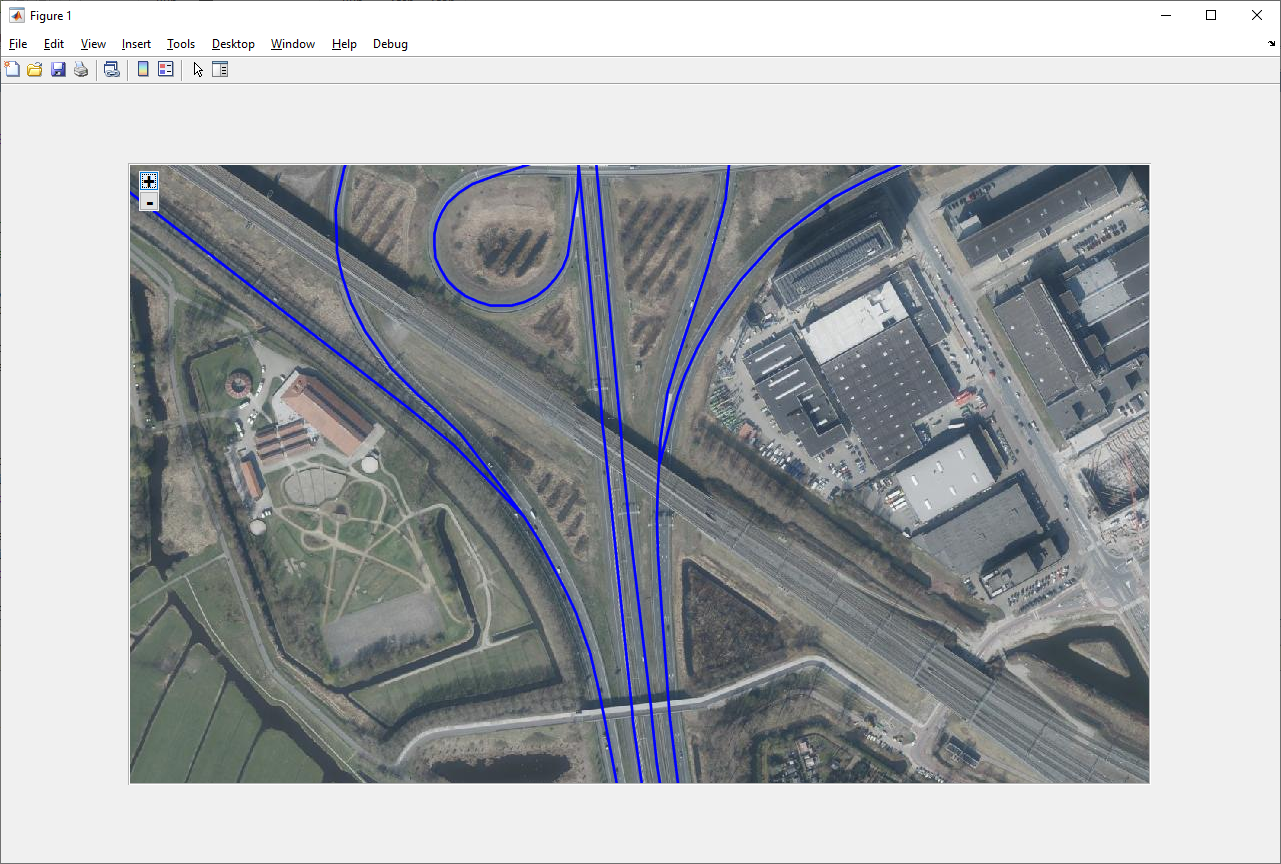
The example as shown above is produced by the next code snippet and contains a zoomable map. To reproduce the example download the free version (see below) and run "WMTS_example".
function WMTS_example

%Open a new figure on monitor 2:
HWIN=figure('pos',[2073 553 560 420]);

%List WMTS layers that are available out of the box:
WMTS_services=modelit.mapviewer.TileSourceFactory.allTileSources;

disp('Available WMTS services')
disp('======================================')
disp(char(WMTS_services.displayName))
disp('======================================')

%In the example below we select 1 of the above. Feel free to experiment
%with other WMTS services
tilesource4example = modelit.mapviewer.TileSourceFactory.create(struct('displayName','Luchtfotos actueel (HR)'));
% tilesource4example = modelit.mapviewer.TileSourceFactory.create(struct('displayName','USGSTopo'));
% tilesource4example = modelit.mapviewer.TileSourceFactory.create(struct('displayName','OpenStreetMap'));

m = modelit.mapviewer.MapViewer(HWIN,'tilesource',tilesource4example);

%Center the map in the figure
set(m.handle,'units','normalized','pos',[.1 .1 .8 .8]);

%A Matlab figure with a zoomable map is now visible.
%Its content is served by (for example) http://a.tile.openstreetmap.org
%Continue by plotting some data of our own:

%load linedata for the Dutch Motorway&Trunk roads network. These data are
%reported in RD coordinates:
data=load('highways.mat','-mat');

if isa(tilesource4example,'modelit.mapviewer.WGS84TileSource')
    %tilesource4example is a WGS service. Conver RD to this coordinates
    %before plotting.
    xy=RD2WGS([data.x,data.y]);
    data.x=xy(:,1);
    data.y=xy(:,2);
end

%Plot the data
h=line(data.x,data.y,'parent',m,'color','r','linew',2);

%Select the Area to display (in this case: range of displayed line)
setVisibleRectangle(m, [ min(data.x),min(data.y),max(data.x)-min(data.x),max(data.y)-min(data.y)]);

%h is a native Matlab line object
get(h)
set(h,'color','b')
set(h,'buttondown',@(o,e)disp('Button Pressed'))
The MapViewer object contains the methods line, patch, image and text to plot data on top of the map. These are used in exactlty the same manner as Matlabs native line, patch, image and text methods. For example, to overlay a road network we load some sample data from the dataset “highways.mat”. This dataset contains the vectors “x” and “y” being the (WGS) coordinates of each road segment, separated by NaN values. The line method creates a native Handle Graphics line object, so line attributes can be used to customize appearance or to add interactive properties.
Converting legacy Matlab code to MapViewer
The conversion of legacy code that displays spatial data starts with replacing the line that creates the original axes with a call to MapViewer.
Replace
m=axes('parent',HWIN);with:
m=modelit.mapviewer.MapViewer(HWIN);In addition there are a few things to look out for.
- Make sure all line, patch, image and text commands mention a MapViewer object as their parent. Typically replace:
line(x,y);with:
line(x,y,'parent',m);This makes sure MapViewer.line is invoked rather then the standard line command.
- for the same reason
set(h,'xdata',x,'yadat',y);must be replaced with :
setlinedata(h,'xdata',x,'yadat',y);This makes sure MapViewer.set is invoked.
- The x and y used in line commands, must match the coordinate system of the map that is being used. For example if the map is based on WGS84, coordinates of lines and patches must be supplied in this system.
- a MapViewer object is cannot be found with "findobj" as it is not a handle graphics object. A quick work around is to create an adhoc function that returns the handle of the MapViewer object.
- Using "get" on objects that are plotted in a MapViewer container may not give a useful result. For example
get(h,'parent') where h is the handle of a line object returns the axes handle of the axes that is part of the MapViewer object, not the MapViewer object itself, and
get(h,'xdata') returns the current pixel coordinates. These depend on zoom level and need to be converted in order to obtain the native coordinates.
About MapViewer
MapViewer:
- was created by Modelit and has been used in various applications for several years;
- is entirely coded in Matlab except for the module that communicates with the Web Map Tile Service (WMTS) provider of choice (for example Openstreetmap). Due to the multithreaded nature of this process MapViewer relies on Java code for this part.
- comes with built in support for zooming, panning and resizing;
- has been tested with all Matlab versions 2013a onwards;
- can be compiled with the Matlab compiler, or deployed as pcode.
Modelit Mapviewer versus Matlab geoaxes
Starting Matlab version 2018b Matlab contains the geoaxes object that can be used to display data in geographic coordinates (latitude/longitude) on a map as well. The comparison sheet below shows a number of characteristic differences between the two.
| Matlab geoaxes | Modelit MapViewer | |
| Code migration | Existing code must be rewritten based on geoaxes object and related plotting commands. No support for patches, images and text objects. | Existing code remains largely unaltered. MapViewer object contains a (hidden) axes that holds all objects that are plotted on the map. |
| Available tileservers | Works with six basemaps that are tiled data sets created using Natural Earth and five high-zoom-level maps hosted by Esri®. Additional maps can be defined, but this requires Mapping Toolbox from the Mathworks. | Works with any WMTS tile server. |
| Extensibility | geoaxes and related functions are pcode only. | Full access to source code of the MapViewer code is available, with the exception of Java code in associated jar files. The code can be inspected, modified and extended. |
Free version
A fully functional free version can be downloaded from this link:
In this version all code except the examples is obfuscated using Matlab pcode. The download is a zip file with m-code, p-code, jarfiles and html help.
Obtaining a commercial license
The difference between the commercial and the free version is that the commercial version contains no p-code. This allows you to inspect every last detail of the code, do small tweaks, and prevents you from running into problems when using the Matlab compiler. When you purchase a commercial license, we will also be able to support you if and when needed.
Consulting
If you wish to extend an existing application with map capabilities, we can take care of the code conversion for you at an attractive rate. Do not hesitate to contact us!
Related information
View our presentation at the event "MATLAB coders Meetup Online" held on March 3 2021.